Trends & Analysis
Platform-wide insights to guide healthier habits and smarter interventions
High Risk
Medium Risk
Low Risk
Unknown
Description
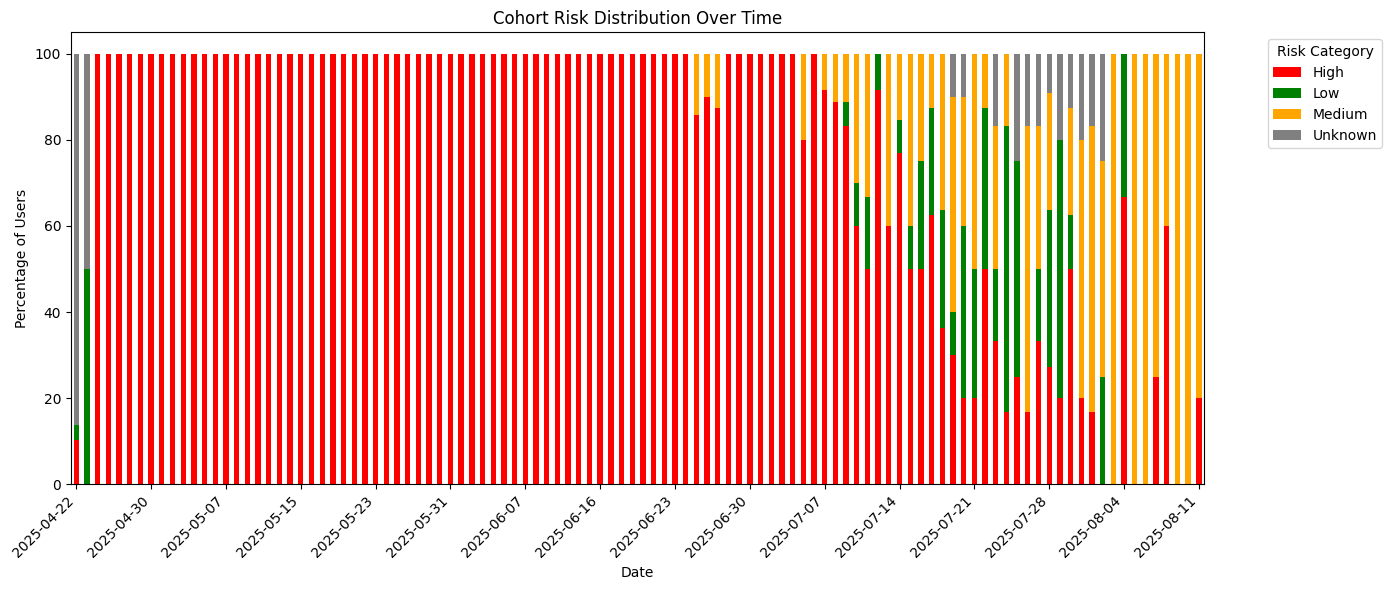
This visualization shows how the distribution of heart health risk categories—Low, Medium, High, and Unknown—changes over time for the entire platform.
- Low Risk: Heart Score ≥ 70
- Medium Risk: 50 ≤ Heart Score < 70
- High Risk: Heart Score < 50
- Unknown: Missing or incomplete heart score data
Insights
- Earlier dates show a higher proportion of High Risk users, indicating limited engagement or poorer baseline health.
- Over time, Medium and Low Risk proportions increase, reflecting improvements or successful EZBEAT interventions.
- Unknown risk decreases as data completeness improves.
Call-to-Action
If you’re in Medium Risk, complete your next milestones (diet tracking, steps, BP update).
If you’re in High Risk, schedule an at-home fitness screen or consult a cardiologist.
Keep your health data updated to avoid “Unknown” and receive tailored nudges.
Description
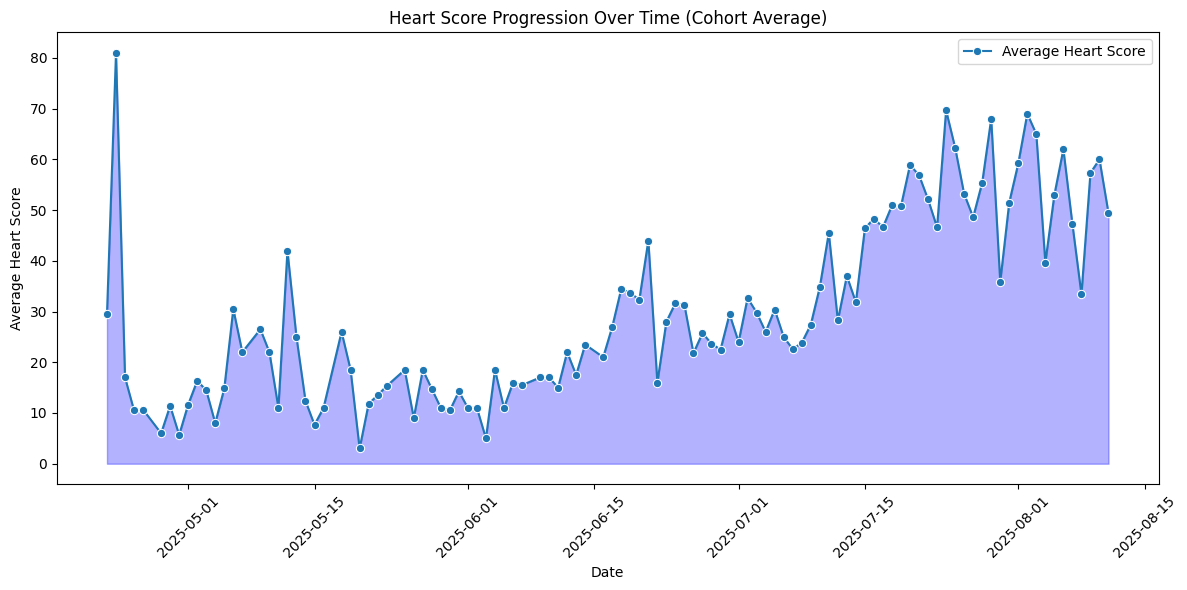
This chart displays the average heart score progression over time for all cohorts combined. The line represents the daily average, while the shaded area highlights the trend magnitude.
Insights
- Clear upward trend in recent weeks suggests improved engagement and healthier behaviors.
- Initial fluctuations likely due to onboarding/incomplete data and early adoption.
- Periodic dips may align with weekends/holidays—opportunities for targeted nudges.
- Widening variability later indicates some users excel while others need more personalized support.
Call-to-Action
Keep your streak going—consistency drives the upward trend.
Counter dips by scheduling short workouts, walks, or mindfulness breaks.
Aim for a Heart Score > 80 to enter Low Risk and unlock rewards.